AACT Member-Only Content
You have to be an AACT member to access this content, but good news: anyone can join!
Rustbusters! A Lab Activity on Corrosion Mark as Favorite (14 Favorites)
LESSON PLAN in Concentration, Reaction Rate, Reduction, Redox Reaction, Chemical Change, Oxidation, Beer's Law, Chemistry of Color. Last updated October 03, 2024.
Summary
In this lesson students learn about factors affecting the rate of corrosion and evaluate the efficiency of different protective coatings to simulate products used in industry when building metal structures like ships or bridges.
Grade Level
High School
NGSS Alignment
This lesson will help prepare your students to meet the performance expectations in the following standards:
- HS-PS2-6: Communicate scientific and technical information about why the molecular-level structure is important in the functioning of designed materials.
- HS-PS1-7: Use mathematical representations to support the claim that atoms, and therefore mass are conserved.
- Scientific and Engineering Practices:
- Using Mathematics and Computational Thinking
- Analyzing and Interpreting Data
AP Chemistry Curriculum Framework
This lesson plan supports the following units, topics and learning objectives:
- Unit 3: Properties of Substances and Mixtures
- Topic 3.7: Solutions and Mixtures
- 3.7.A: Calculate the number of solute particles, volume, or molarity of solutions.
- Topic 3.13: Beer-Lambert Law
- 3.13.A: Explain the amount of light absorbed by a solution of molecules or ions in relationship to the concentration, path length, and molar absorptivity.
- Topic 3.7: Solutions and Mixtures
- Unit 4: Chemical Reactions
- Topic 4.1: Introduction for Reactions
- 4.1.A: Identify evidence of chemical and physical changes in matter.
- Topic 4.9: Oxidation-Reduction (Redox) Reactions
- 4.9.A: Represent a balanced redox reaction equation using half-reactions.
- Topic 4.1: Introduction for Reactions
- Unit 5: Kinetics
- Topic 5.1: Reaction Rates
- 5.1.A: Explain the relationship between the rate of a chemical reaction and experimental parameters.
- Topic 5.1: Reaction Rates
Objectives
By the end of this lesson, students should be able to
- Evaluate the efficiency of a protective coating based on qualitative and quantitative results.
- Use spectrophotometry and Beer’s Law to generate data to characterize the rate of a reaction.
Chemistry Topics
This lesson supports students’ understanding of
- Chemical Reactions
- Rates of Reaction
- Indicators of Chemical Reactions
- Redox reactions
- Solutions
- Concentration
- Spectrophotometry
- Beer’s Law
Time
Teacher Preparation: 1 hour
Lesson:
- Engage: 10 minutes
- Explore: Day 1: 60 minutes; Day 2: 125 minutes
- Explain: 30 minutes
- Elaborate: 45 minutes
- Evaluate: 45 minutes
Materials:
Engage Section:
- Commercial heat pack
- Thermometer
Explore Section (6 groups):
Day 1:
- 24 Iron strips cut approximately 3 cm x 1 cm. Flinn iron strips or iron sheets work well.
- Flinn #I0058 is a package of 10 iron strips, 6" x 0.5" x 0.024"
- One package can make 50 approximately 1cm x 3cm strips
- Flinn #I0015 is a single sheet of iron, 12” x 12” x .024”
- One sheet, if cut perfectly, can yield 300 1cm x 3cm strips
- Note: it is not easy to cut iron in this way, unless you have access to shop equipment. If your school has a metal or wood shop, ask if they have something that could cut 24 gauge iron like this.
- Flinn #I0058 is a package of 10 iron strips, 6" x 0.5" x 0.024"
- 24 small binder clips (for hanging coated strips to dry)
- You will also need to find a place to hang the strips to dry. This can be done clothesline style for the whole class or you could have students tape string to a beaker and hang each strip in a different beaker.
- Protective coatings (suggestions are below, but be open to other student ideas)
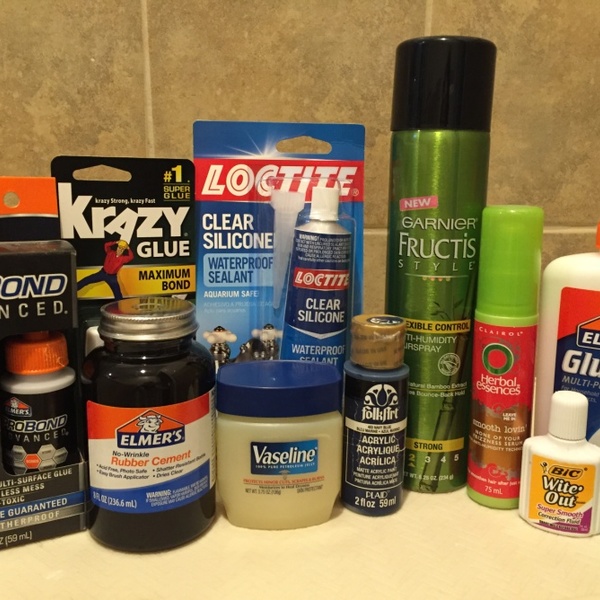
- Elmer’s glue
- Liquid white-out
- Acrylic paint
- Cooking oil
- Vaseline petroleum jelly
- Lip gloss
- Clear nail polish
- Masking tape
- Spray glue
- Hair spray
- 12 graduated cylinders, 25-mL
- 6 graduated cylinders or graduated pipettes, 10-mL
- 6 burets, 50-mL
- Distilled water for student solution preparation (~100 mL per group)
- Solutions
- 1 L of 0.50. mg/L ferrous ammonium sulfate (FAS) solution (see Teacher Preparation notes for further detail)
- 150 mL of 0.25% (w/v) 1,10-phenanthroline (0.375 g for 150 mL solution)
- 50 mL
of 1% (w/v) Ascorbic acid (0.50 g ascorbic acid for 50 mL solution
- Alternative is household vinegar at normal strength
- 175 mL of 17.5% (w/v) sodium chloride (30.6 g NaCl for 175 mL solution)
- 6 Vernier spectrophotometers
- 6 Cuvettes for spectrophotometer
- Kimwipes
- 6 volumetric flasks, 100-mL
- 18 Beakers, 50-mL, or small plastic cups
- 6 graduated cylinders, 25-mL
- 18 graduated cylinders or graduated pipettes, 10-mL (alternatively, students can use a single cylinder or pipet and rinse it out between solutions, thus needing only 6 for the class)
- 24 Beakers, 50-mL or plastic cups (for students to obtain each of the four stock solutions for making their soaking solutions.
- 6 Vernier spectrophotometers
- 6 Cuvettes
- Kimwipes
- 24
Beakers or Erlenmeyer flasks, 50-mL or small plastic cups
- Students will need to place their strips in a soaking solution. A flask is useful because the strip can stand up in the flask, if sized appropriately. A beaker or cup is also suitable, but you may want to secure the strip with tape so all have a consistent area of soaking.
- Stopwatch
Day 2:
Safety
- Always wear safety goggles when handling chemicals in the lab.
- Students should wash their hands thoroughly before leaving the lab.
- When students complete the lab, instruct them how to clean up their materials and dispose of any chemicals.
- Edges of the metal strips may be sharp. Handle with care. It is recommended that the edges be polished using steel wool before distributing in class.
- Sulfuric acid should be used only in the hood, and gloves should be worn.
- 1,10-phenanthroline is highly toxic by ingestion. Refer to Safety Data Sheet for additional information.
Teacher Notes
- This experiment is designed for a first-year honors chemistry class. There are several places where additional information or requirements could be added to make it suitable for a 2nd-year chemistry class.
- Prior knowledge needed:
- Use of a spectrophotometer and application of Beer’s Law
- Molarity calculations
- Basic introduction to oxidation-reduction reactions
- Dimensional Analysis
- Creating graphs
- The teacher will need to prepare solutions prior to class, see the material lists for the solution information.
- Engage: Show a heat pack and ask students why they think heat is generated. Demonstrate how to use it, while taking note of the temperature just after opening the packaging for the heat pack and then a minute or two later when it is hot. Refer to this article from Wired about Hand Warmers.
- Iron reacts with oxygen from the air to form rust
- Sodium chloride is added to assist the rusting reaction
- Activated charcoal adsorbs and retains moisture to facilitate the rusting reaction
- Vermiculite acts as an insulator
- Porous packaging allows oxygen in and efficient heat transfer
- Although the formation of iron (III) oxide in the heat pack is beneficial because it is a source of heat during the cold weather, ask students what are the drawbacks of this rusting process. Let them look at the finish of the brand new car like that in the following picture and ask them what will happen if it does not have any protection at all against rain and dirt.
- Rusting is a form of corrosion, which is the destructive oxidation of a material.

- Explore: Each group is assigned either two coatings or one coating and one uncoated control. To minimize equipment needs, students should work in 6 groups of approximately 4 students. The material amounts are given for a total of 6 groups. This allows for a variety of data to be collected by the class. The teacher should determine the best way to allow all data to be shared. Options include: GoogleDrive or other classroom platforms, collecting data and photocopying for distribution or simply having all students hang their final graphs on the front board with tape or magnets.
- The procedure requires that students know how to calibrate the spectrophotometer, how to do a full spectrum run to determine the optimum wavelength, and how to measure the absorbance readings for both the standard and unknown solutions. The teacher should give directions specific to the brand of spectrophotometer or colorimeter available.
- Useful websites/videos on spectrophotometry are:
- To monitor the rate of corrosion of the experimental samples, fifteen-minute intervals between absorbance readings is suggested. However, measuring absorbance at shorter time intervals may be considered, especially for 40-minute class periods.
- There are two types of controls built into this experiment.
- Uncoated iron strips will be used to compare how the coating compares to no coating.
- Each strip will be soaked in water and in a solution designed to mimic environmental conditions. The water will allow a comparison of how the presence of ions affects the corrosion rate. Salt and acid are added to simulate actual rain conditions.
- The use of 1,10-phenanthroline in each soaking solution allows for spectrophotometric analysis. This forms a soluble red complex ion with the iron(II) ion. The intensity of this color over time, as measured by absorbance, will allow a quantitative measure of the corrosion rate. The color intensity of the iron complex is stable between pH 2 to 9. Maximum absorbance is observed at a wavelength value of 507 nm.
- Teacher Preparation, Day 1:
- Collect various items to be used as coatings (suggested list in the Materials section).
- Distribute materials to each group, or place them in a common area.
- Prepare solutions for the standards. These may be placed in a dispensing area for students to collect or they may be distributed to each lab table. (Note: To minimize equipment needs, each group is assigned one of the 6 standards to create for the class.) The following amounts are needed if it is to be in a common area.
- 150 mL of 0.25% (w/v) 1,10-phenanthroline
- 50 mL of 1% (w/v) Ascorbic acid or household vinegar
- 175 mL of 17.5% (w/v) sodium chloride
- Due to
the small amount needed, the teacher will need to do a serial dilution to
prepare the FAS stock solution that will be used by students for their
standards. For best results, use the FAS solution within 24 hours.
- Weigh 0.50 g of the ferrous ammonium sulfate (FAS) and dissolve in about 800 mL of distilled water.
- Add 2.0 mL of 6M sulfuric acid.
- Dilute to 1 liter in a 1-L volumetric flask.
- Take 100. mL of this prepared solution and dilute it to 1 liter in a 1-L volumetric flask.
- As the FAS concentration is the determining factor for the Beer’s Law plot, this should be measured as precisely as possible. Prepare 6 burets with this solution and distribute one to each group.
- Students should read the background information and then answer the pre-lab questions. To save time, this could be assigned as homework.
- After reviewing the answers to pre-lab questions, initiate a discussion about what properties an effective coating might have and do a class brainstorm to develop a list of common materials that might be tested as coatings. Some suggested coatings are listed in the Materials section above. Some properties to look for during the brainstorm are:
- Sticks (adheres) to the metal surface
- Stays on the surface indefinitely
- Waterproof
- Doesn’t react with common ions in rain
- Doesn’t react with the metal surface (unless in a non-damaging way)
- Assign each pair of students either two coatings or one coating and an un-coated control.
- Outline of the student procedure:
- Day 1:
- Students prepare their iron strips with the assigned coating
- Students make standards and then create the Beer’s Law calibration plot
- Day 2:
- Students prepare a control solution and an environmental conditions solution for each of their coatings
- Students use a spectrophotometer to measure the absorbance at maximum wavelength for each of their four solutions every 15 minutes. Timing suggestions are included in the student directions.
- Day 1:
- Using prior knowledge on dilution, students will calculate the volume of the stock 50 mg FAS/L solution that will be needed to prepare the standards for the calibration curve. This is part of the Pre-Lab section and can be done as homework if desired. Teacher should check and approve volume values prior to students preparing the standard solutions. A summary of the volume values for the stock is given below:
|
Standard Solution Concentration (mg FAS/L) |
Volume of 50 mg/L stock solution of ferrous ammonium sulfate (FAS) (mL) |
|
20. |
40. |
|
16 |
32 |
|
12 |
24 |
|
8.0 |
16 |
|
4.0 |
8.0 |
|
2.0 |
4.0 |
- Explain: The Data Analysis guides students to interpret their data and make decisions about which coatings worked best. The Conclusions prompt students to explain their understanding of the corrosion process. You may want to use the following information to help guide students toward being observant in their qualitative observations. They should note the change in color of the solution the metal is immersed in, the amount of area on the metal that corrodes and the appearance of the protective coating after immersion in the salt-acid solution.
|
Industrial Descriptions of Paint Failures |
||
|
Paint Failure |
Description |
Probable Cause |
|
Sags |
Also called runs or curtains |
Too much paint, paint too thin, surface too glossy to hold paint |
|
Orange peel |
Hills and valleys similar to orange skin |
Paint too viscous, paint evaporated too fast |
|
Cratering |
Pitting, small uniform indentations |
Air pockets trapped during application |
|
Fish eyes |
Separation or pulling apart of the coating exposing metal surface |
Presence of dirt or oil before application* |
|
Wrinkling |
Rough, crinkled surface |
Uncured coating, needs more time to dry |
|
Cracking |
Deep cracks that expose the metal surface |
Coating shrinkage, poor adhesion |
|
Delamination |
Coat being separated from the metal |
Poor adhesion |
Examples of Coating Failures that may be seen in this lab:
- Wrinkling - bumpy, rough, crinkled surface for red acrylic but the solution is relatively clear.

- Clear delamination of the glue coating, resulting to metal exposure as evidenced by the intense orange color. This indicates high level of Fe2+ in solution.
- Coated with Witeout brand correction fluid - still intact surface and relatively colorless solution but orange color is visible around the cut edges of the metal strip possibly due to insufficient coating.

- The above possibilities will help students evaluate whether the coating "failure" is due to the coating itself or to the applicator's lack of technique or insufficient metal surface preparation. *Iron strips from science suppliers are usually coated with thin layer of oil to prevent rusting. Sandpaper or steel wool may be used to clean the strips before distributing to students.
- Quantitative level of corrosion for the control and experimental samples will be calculated using the previously made calibration curve.
- Elaborate: The student document, “Rustbusters!
Digging Deeper” guides students toward investigating how the coatings can stick
to the metal surface. It gives them a
very brief introduction to the types of molecules that can form a film to
protect the surface. This will help them
to think about why some of the coatings were better than others.
- Some films are formed when a polymer dissolved in a solvent dries (solvent evaporates).
- Some films are formed when smaller molecules react with light or oxygen in the air and polymerize.
- Some films stick to the metal surface by “wetting” it (molecules fill into the pores in the surface).
- Some films stick to the metal surface by hydrogen-bonding interactions with the oxide coating on the metal.
- Some films stick to the metal surface by electrostatic interactions.
- Evaluate: The student document, “Rustbusters! Corrosion Resistance Assessment” guides students to use the information learned throughout this lesson to develop their own “best” coating. They will design an experiment to test their theoretical coating and will explain the qualities that make it a good coating by defending its superiority so an industry will purchase it.
- References:
- Morae, E. P. Confessor, M. R., Gasparotto, L. H. S. (2015). Integrating mobile phones into science teaching to help students develop a procedure to evaluate the corrosion rate of iron in simulated seawater. Journal of Chemical Education, 2015(92), 1696-1699
- Runyan, T. (1993). Investigating Protective Coatings from Steel. Filtrates & Residues , 70(10), 843-845.
For the Student
Downloads all documents for this lesson, including the Teacher Guide, from the "Downloads box" at the top of the page.